Most growth-stage businesses underestimate customer churn until it shows up in a board deck. By that point, the revenue has already gone, and the operational signals that predicted it were sitting unread in a CRM, a support queue, or a billing log. Churn rarely arrives suddenly. It builds over renewal cycles, support escalations, and product usage declines, and businesses that catch it early treat retention as a measurable process, not a soft skill.
The cost of replacing a churned customer almost always exceeds the cost of keeping one. Acquisition pipelines run on advertising spend, sales rep time, and onboarding effort, while retention work compounds the value of customers already paying. According to Bain & Company research published in Harvard Business Review (2014), increasing customer retention rates by 5% increases profits by 25% to 95%, depending on the industry. That spread is the entire reason churn analysis is non-negotiable for SaaS, subscription commerce, and any business with renewal-driven revenue.
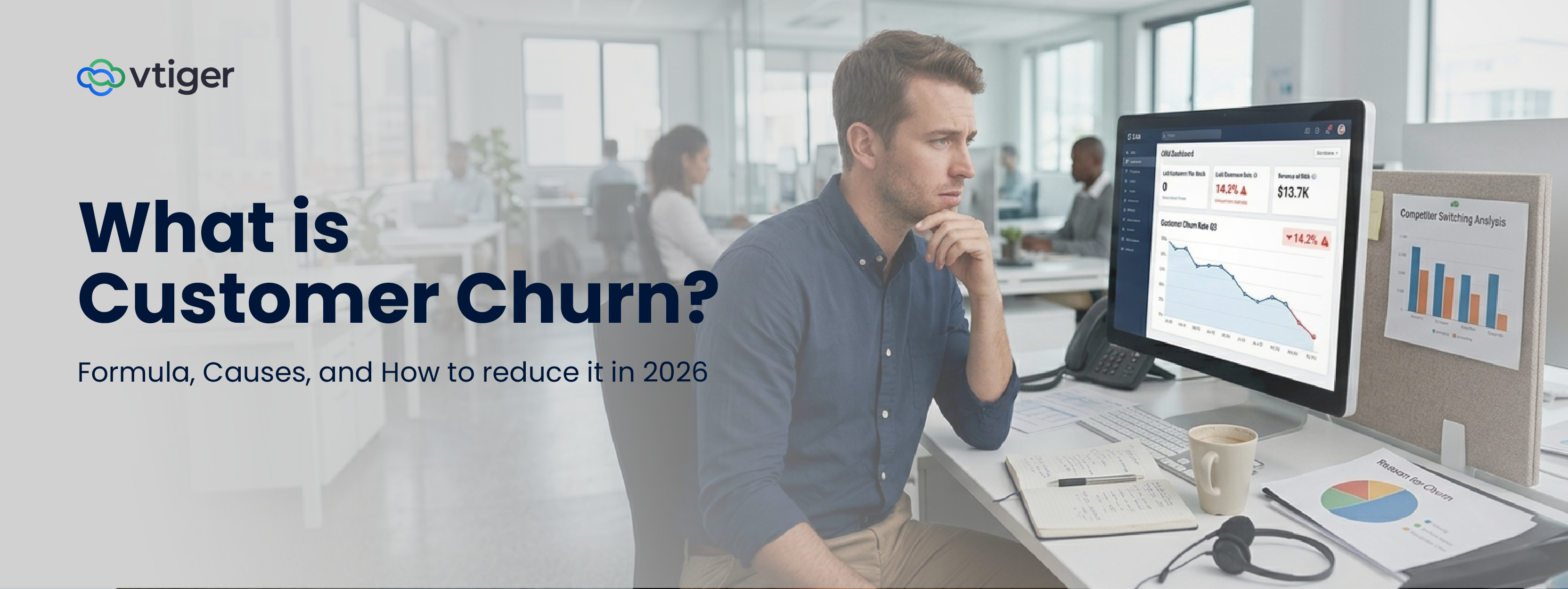
What Is Customer Churn in Business
Customer churn is the proportion of customers who end their relationship with a business over a given period, expressed as a percentage of the starting customer base. The relationship can end through outright cancellation, non-renewal, a downgrade to a free tier, or simply no purchase over a defined window, depending on the business model. The term is used interchangeably with customer attrition or customer turnover in many industries.
Churn is not a single metric in disguise. It is a family of metrics tied to different revenue events. Customer churn counts logos. Revenue churn counts dollars. Net revenue includes expansion revenue from existing accounts.
In operational terms, churn is the lagging indicator that surfaces the result of decisions made months earlier. The onboarding flow that confused new users, the support ticket that took five days to close, the feature gap that drove a buyer to a competitor.
Each of these inputs feeds into the churn rate the business reports next quarter. Treating churn as a single number to reduce the miss point. It is the readout of a customer experience system, and reducing it requires changes inside that system.
How to Calculate Customer Churn Rate
The churn rate formula is straightforward, but the inputs require discipline to define correctly. Most reporting errors in churn come from inconsistent period boundaries, blended customer segments, or counting trial users as paying customers.
Standard Customer Churn Rate Formula
Customer Churn Rate =(Customers Lost During Period / Customers At Start Of Period) × 100
Customer churn rate equals the number of customers lost during a period divided by the number of customers at the start of that period, multiplied by 100. If a business starts a quarter with 2,000 customers and loses 80 by the end, the quarterly churn rate is 4%. The choice of monthly, quarterly, or annual reporting matters because churn compounds, and a 5% monthly rate translates to roughly 46% annual attrition.
The denominator must be the count at the start of the period, not a running average or the end count; otherwise, the figure becomes mathematically incoherent. Acquisition during the period is excluded from the calculation. A customer who joins on day 10 and cancels on day 25 within the same period does not factor into this calculation, although they should be tracked in a separate trial-to-paid conversion metric.
Revenue Churn and Net Revenue Retention
Revenue Churn Rate = (Recurring Revenue Lost During Period / Recurring Revenue At Start Of Period) × 100
Revenue churn measures lost monthly or annual recurring revenue rather than lost accounts. It captures downgrades, partial cancellations, and seat reductions that customer churn alone misses. A business losing one enterprise account paying $40,000 a year has the same logo churn as losing one $200/per month customer, but the revenue impact is 200 times greater.
Net Revenue Retention =(Starting Revenue + Expansion Revenue−Downgrade Revenue−Churned Revenue/Starting Revenue) × 100
Net revenue retention includes expansion revenue in the calculation. It measures whether the revenue from the customer cohort that existed at the start of the period is higher or lower at the end of the period, after upgrades, expansions, and downgrades. A net revenue retention above 100% means the existing book of business is growing on its own, before new acquisitions are counted. Investors treat this number as a leading indicator of compounding growth, and CRM systems that connect billing, support, and product usage data make it reliably trackable.
Types of Customer Churn Every Business Should Track
Churn divides into three operationally distinct categories. Each has distinct root causes and intervention paths, so treating them as a single number flattens the diagnosis.
- Voluntary churn happens when a customer actively decides to leave. They cancel a subscription, switch to a competitor, or stop renewing because the product no longer matches their needs. Voluntary churn is the most addressable category because customers’ reasoning is often recoverable through exit surveys, account health monitoring, and proactive intervention.
- Involuntary churn occurs when external factors end the relationship without the customer’s decision. Expired payment cards, failed credit card charges, or insufficient bank funds all cause involuntary churn in subscription businesses. Recovery campaigns through dunning emails and updated billing capture a significant share of this loss.
- Revenue churn is technically a measurement category, but it is treated as a type here because it reframes the question. A customer who stays but downgrades from an enterprise tier to a starter plan does not appear in logo churn at all. The account remains, the revenue does not. Tracking revenue churn separately from customer churn keeps the financial reality visible.
What Causes Customers to Churn
The reasons customers leave are knowable, but most businesses learn them through inference rather than direct evidence. Exit surveys are completed by a fraction of churning customers, and the responses rarely capture the full reason. The patterns below come from cross-industry research and observed CRM data, and each maps to an operational lever the business controls.
Poor Customer Experience and Slow Support
Customer experience problems do not need to be dramatic to drive churn. Friction accumulates across small interactions. A support ticket that takes too long to acknowledge, a billing query that gets bounced between teams, a product flow that takes three clicks where it should take one. PwC’s Future of Customer Experience research found that 32% of customers would stop doing business with a brand they previously loved after just one bad experience. The threshold for losing a customer is far lower than most businesses operate as if it were.
Support response time is the single most visible signal of customer experience quality in subscription businesses. CRM platforms that route support tickets by priority and track SLA compliance reduce the variance in response quality, which is what customers actually notice. A median response time of two hours with occasional 24-hour outliers feels worse to a customer than a consistent 6-hour median, because the outlier is the experience that gets remembered.
Weak Product Value and Underused Features
When customers do not see ongoing value from a product, they reassess the spend at the next renewal. Underused features are a measurable indicator. A SaaS business that sees an account using fewer than three of the fifteen purchased modules has a churn risk it can intervene on before renewal. Product usage data fed back into CRM software lets customer success teams see which accounts are drifting before the cancellation request arrives.
The fix is not always teaching customers to use more features. Sometimes the right action is downgrading the customer to a plan that matches actual usage, which prevents full churn at the cost of revenue churn. That trade is almost always worth taking. A reduced-revenue customer who stays is recoverable. A churned customer is a separate sales cycle.
Pricing and Competitive Pressure
Pricing-driven churn is more nuanced than buyers leaving because a competitor is cheaper. It happens when the customer’s perceived value has dropped to a point where any external alternative looks more attractive. A competitor entering the market with a comparable feature set at 30% lower pricing will pressure the renewal conversation for every existing customer, regardless of whether the customer was previously satisfied.
The response is rarely a price cut. It is a clearer demonstration of value in the renewal cycle, often through usage reports, ROI summaries, and account reviews that document what the customer has actually achieved on the platform. Renewals handled as commercial check-ins, not as value reviews, lose at materially higher rates.
How to Reduce Customer Churn
Reducing churn is operational work distributed across product, support, customer success, and revenue teams. The interventions below are sequenced from highest to lowest leverage, based on their cumulative effect on retention.
Improve Onboarding to First Value
Customers churn fastest in the first 30 to 90 days, before they have integrated the product into their workflow. Onboarding that gets a customer to a first measurable outcome quickly cuts early-stage churn more than any post-purchase intervention. The onboarding sequence should be designed around the customer’s success milestone, not the product’s feature list. A customer who has completed the workflow they bought the product for in the first week has a fundamentally different retention curve than one still figuring out the dashboard at day 30.
Personalize Engagement Across the Lifecycle
McKinsey research on personalization (2021) found that companies that grow faster drive 40% more of their revenue from personalization than their slower-growing counterparts, and that personalization can lift revenue by 5% to 15% while increasing marketing spend efficiency by 10% to 30%. The mechanism is straightforward. Personalized outreach assumes the customer is at a specific point in their journey and responds to it. Generic outreach assumes nothing and resonates with no one.
The CRM-side implementation involves segmenting customers by behaviour, lifecycle stage, and value tier, then driving outreach through workflows tied to those segments. A renewal reminder that names the modules the customer used most often performs differently from a generic renewal email. The infrastructure for that segmentation lives in a unified customer profile that connects sales, marketing, and support data into a single record, which is what customer engagement systems aim to provide.
Use Predictive Signals to Spot At-Risk Accounts
Churn prediction is now operationally tractable for businesses that have organized their customer data into a single system. Usage decline, support ticket frequency, contact drop-off, and proximity to contract anniversary all feed into a churn risk score that flags accounts for intervention before they cancel. Vtiger’s Calculus AI surfaces these signals as next-best-action recommendations for customer success managers, so the human decision is informed by the data without being replaced by it.
Build Structured Renewal and Expansion Workflows
Renewal conversations that happen 30 days before the contract date are firefighting. Renewals managed through structured workflows that begin 90 to 120 days before contract expiry, with value reviews, executive check-ins, and expansion conversations sequenced across that window, close at materially higher rates. Workflow automation builders inside the CRM make this sequencing repeatable across the customer base, rather than dependent on individual account managers’ memory.
Run Disciplined Exit Interviews
Every churned customer is a lost data point if no one captures the reason for the churn. Even brief exit surveys, asked at the point of cancellation with two or three pointed questions, accumulate into a directional dataset over time. The categories that emerge from those answers tell the product, pricing, and customer success teams which upstream problems are actually driving losses.
Customer Churn Examples Across Industries
Churn behaves differently across revenue models, and interventions that work in one industry can be irrelevant in another.
- SaaS businesses see churn driven primarily by low product adoption, missing integrations, and pricing pressure at renewal. The lever is usage-driven customer success and proactive renewal management.
- E-commerce subscriptions see churn driven by perceived value decay, where the customer feels the recurring delivery no longer matches what they wanted at signup. The lever offers personalization and pause-instead-of-cancel flows.
- Telecom and utilities see churn driven by competitive pricing and complaints about network or service quality. The lever is service-quality monitoring and contract-anniversary outreach with retention offers.
- B2B professional services see churn driven by relationship turnover at the client account when the original champion leaves. The lever is multi-threading the relationship across multiple stakeholders, not just the original buyer.
- Financial services and banking see churn driven by life events such as moving, life-stage changes, or competitor offers that match the moment. The lever is event-based outreach tied to AI in business signals that surface life-stage transitions.
Best Practices for Long-Term Customer Retention
Customer retention works best when it becomes part of daily operations instead of a one-time campaign. Businesses that retain customers successfully usually focus on consistent systems, smooth customer experiences, and measurable outcomes across teams.
Create a Unified Customer Profile
Every team should work from the same customer information. When support, sales, and marketing teams all see different records, customers experience delays, repeated questions, and inconsistent communication.
A unified customer profile that combines support history, billing details, conversations, and product usage helps teams respond faster and make better decisions throughout the customer journey.
Focus Strongly on the First 90 Days
The first 90 days often decide whether a customer stays long-term. Early-stage churn usually happens because customers fail to see value quickly enough.
Businesses should treat onboarding as a dedicated retention stage with clear goals. Instead of ending onboarding after tutorials or setup steps, the process should end when customers achieve their first meaningful result.
Measure Customer Success With Retention KPIs
Customer success teams need measurable goals tied directly to retention outcomes. Without clear KPIs, teams may focus on completing activities instead of improving customer loyalty.
Metrics such as churn rate, net revenue retention, customer cohorts, and time-to-first-value help businesses understand whether retention efforts are actually working.
Use Lead Management Beyond Customer Acquisition
Lead management should continue even after a customer signs up. The same system that tracks leads can also help identify customers at risk of leaving.
When businesses treat acquisition and retention as part of a single, continuous customer data process, teams can respond earlier to warning signs and improve long-term customer relationships.
Build Structured Retention Workflows
Retention becomes more effective when teams work with the full customer context rather than reacting only during renewal periods.
Vtiger’s One View consolidates sales, marketing, and support data into a single customer record, so customer success teams operate with the full context for every renewal conversation. The retention work then becomes structured rather than reactive.
Frequently Asked Questions (FAQs)
1. What is customer churn in simple terms?
Customer churn is the percentage of customers who end their relationship with a business over a defined period. It applies to subscription cancellations, contract non-renewals, and customers who stop purchasing entirely. Churn is one of the clearest indicators of how well a business is delivering ongoing value, because customers who feel they are getting their money’s worth tend not to leave.
2. What is considered a good customer churn rate?
A good churn rate depends heavily on industry, business model, and customer segment. SaaS companies typically target annual customer churn below 5% to 7% for SMB segments and below 1% to 2% for enterprises. Telecom often runs at 1% to 2% monthly. Comparing churn against a sector benchmark is more useful than measuring against a universal target.
3. How is customer churn calculated?
The standard formula divides the number of customers lost in a period by the number of customers at the start of that period, then multiplies by 100. New customer acquisition during the period is excluded. Revenue churn uses lost recurring revenue in the numerator rather than lost accounts, capturing downgrades that logo churn misses.
4. What causes the highest customer churn?
Poor onboarding, weak perceived product value, slow or inconsistent customer support, and competitive pricing pressure are the most common causes. Most churn results from a combination of these rather than a single trigger. The pattern of low product usage combined with a support escalation in the prior 30 days is one of the strongest predictive signals.
5. Can customer churn be predicted with data?
Customer churn can be predicted with usable accuracy when product usage, support history, and engagement data are connected in a single system. Predictive scoring is most reliable in SaaS and subscription models where regular usage data is available. The prediction needs human judgment to act on, because the right intervention varies by account.
6. What is the difference between voluntary and involuntary churn?
Voluntary churn happens when a customer decides to leave. Involuntary churn happens when external factors end the relationship, such as failed payment processing or expired credit cards. Involuntary churn typically accounts for 20% to 40% of total churn in subscription businesses and is recoverable through dunning automation and updated payment workflows.
7. Why is retaining customers more profitable than acquiring new ones?
Retention compounds the value of customers already paying, while acquisition incurs sales and marketing costs on every new account. Existing customers also expand spending over time, and the marginal cost of serving them is lower than the cost of converting a new lead. The Bain research showing a 5% increase in retention, driving a 25% to 95% profit lift, stems from exactly this compounding effect.