When it comes to research techniques, there is an example I like to share. On April 23, 1985, Coca-Cola released a new version of their classic soda called New Coke. This formula was tested thoroughly before release. Up to 200,000 people tried the new soda. A majority agreed that the taste was better. Upon its release, there was global outrage. As it turned out, Coca-Cola failed to account for other reasons consumers purchased their soda. Coca-Cola has shared this story on its website. I highly recommend reading it.
You may be wondering why I have shared this story and how it relates to A/B testing. The primary takeaway is when you are conducting research, you do not want to rush the process. Take the time before beginning the tests to find all possible variables and how you wish to test each one.
So what is A/B testing?
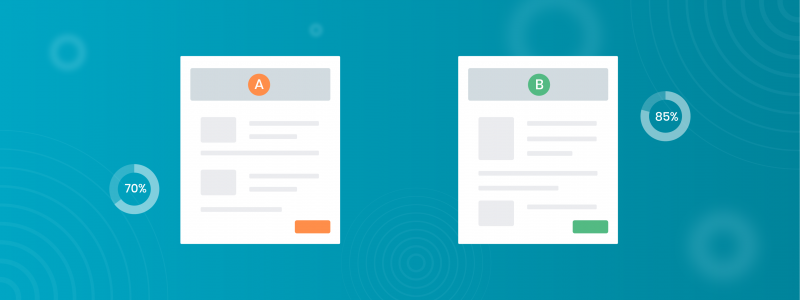
If you are not familiar, A/B testing is a research method in which two versions of one item are tested to figure out which achieves the best results. I’m afraid it is not quite as simple as the definition sounds. There is a process of statistical analysis required to help interpret your results and guarantee that business decisions made, even small ones, will have an impact.
Begin your journey into the exhilarating world of statistical analysis with the concepts below:
- Mean, variance, and sampling
- Statistical significance
- P-values
- Statistical power
- Confidence intervals and margin of errors
- Regression to the mean
- Segmenting
- Confounding variables and external factors
These topics and links are all from a very well-written article titled “A/B Testing Statistics: An Easy-to-Understand Guide”. I promise I am not trying to assign you homework. These topics are simply the foundation for proper statistical analysis. Without these, you may as well not perform the A/B tests at all.
With that foundation in mind, I now want to break down how you would approach A/B testing. If you have been or are currently in a sales position, I am sure you have experienced A/B testing in small ways. The testing is conducted by sending out the same email with different email subjects or changing aspects of your cold call script to see which version has the best results. The problem with this approach is that it is imprecise. Multiple variables could be changed, the sample size could be too small, or the company title of those receiving the call or email could differ.
The most common issue is generally the first one I mentioned. It is common to unintentionally modify multiple variables. With A/B testing, you will only focus on just one variable to test, with everything else being constant. If you would like to change multiple variables in one test, you could go with the multivariate statistical process, but that is a conversation best saved for a different day. I would recommend reading the blog by Analytics-Toolkit.com if you are interested.
I like to break the A/B testing process into three steps: Research, Testing, and Analysis.
Step 1: Research and Defining the Test
Initial research into your existing sales processes is a vital part of the testing process. In this step, you will want to test all variables related to the A/B tests. The testing could include the current response rate of existing email templates, the closing rate for phone call scripts, and even the time of day the salesperson reaches out to the prospects.
After the initial testing, you will need to gather all of the relevant prospect information you currently have available. This data will often include their industry, their current role, the prospects’ location, and any other information you may wish to test.
Spending the time now to perform this research and gather the results can save a lot of time down the road. This research will also help you properly frame the A/B tests you plan on performing.
From here, you will want to choose if you wish to create a one-tailed or two-tailed test. A one-tailed test will only test for changes in one direction while a two-tailed test will test for changes in both positive and negative directions.
There has been an ongoing argument over which is better, but I prefer one-tailed tests for A/B tests. I still recommend reading more on each. You should start with this blog titled, “One-Tailed vs. Two-Tailed Tests (Does It Matter?)”.
After we have our type of test chosen, you can now create the null and alternative hypotheses.
I find an example works best here, so let’s say you wish to test the open rate between an existing email subject line and a new shorter version you and your team have written. We believe that the shorter email subject line will lead to more emails being opened. Our null and alternate hypotheses are below.
Null hypothesis (H0): There is no significant difference in email open rates between the long and short email subject lines.
Alternate Hypothesis: The short email subject line had more emails opened than the longer email subject line.
You can now consolidate your sample. Sampling is another topic that at the surface seems simple, but finding the perfect sample size requires an understanding of your required confidence level, the margin of error, and population size. The higher the confidence level and lower the margin of error, the longer the test will take. It is good to approach these topics with your budget and time limit in mind.
Qualtrics has an amazing article and tool available to help determine the sample size you need.
Now, you can gather the prospects that will make up your sample you plan on running the test with.
Let’s take our example from earlier that you wish to test the open rate between an existing email subject line and a new shorter version you and your team have written.
You know that you want a 95% confidence level (Z-score is 1.96) with a 5% error rate (The default values many statisticians use for this analysis). For population size, you plan on sending this out to all C-Suite executives handling Business to Business Sales in the United States in companies with 1,000 employees or more.
There is not a census available for the number of C-Suite executives in the United States, but we can come up with a good estimate. Generally, companies contain a maximum of two C-suite executives that help with sales. There are statistics available stating that 23,533 companies exist in the United States with 1,000 employees or more. We can take that number and multiply it by 2 for the number of C-suite executives. This gives us a population size of 47,066.
Qualtrics offers a free ideal sample size calculator. Using that gives us an ideal sample size of 382.
Step 2: Testing
The testing step is the one I find to be the most exciting. Here you will be able to create and begin your testing fully.
Depending on what you are testing, you will want to make sure you have the necessary tools to track the results. This will often include such features as email engagement tracking, Phone Call tracking and recording, and analysis or reporting software.
With the needed tools in hand, let’s look back to the example I gave earlier. We have our sample size of 382 prospects and our two emails created.
You can now send one of the emails to 191 contacts and the second email to another 191 contacts. After the emails are sent, there is nothing left to do but wait. I recommend choosing a time period beforehand that will give the contacts enough time to open the email. For this example, let’s say we give them one week.
After the week is up, we have our results. I have made up the results for the example below.
Long Subject Line (Control Variable): 191 Emails Sent
Emails opened: 92
Emails unopened: 99
Short Subject Line: 191 Emails Sent
Emails opened: 121
Emails unopened: 70
With our results, it can already be seen that the short subject line resulted in a larger number of emails being opened. I still recommend following through with the third step, analysis.
Step 3: Analysis
The analysis of an A/B test is more so defined as testing the new change against the null hypothesis or the control variable. What you are looking for is whether the results are statistically significant.
There are a lot of formulas involved in the full analysis. If you wish to do all of the calculations by hand, I recommend reading the article “One-tailed vs. Two-tailed Tests – Everything You Possibly Need to Know One-tailed vs. Two-tailed A/B Testing”. I am positive there are many statisticians that handle the calculations by hand. In our case, there are many free and paid resources online we can use for the calculations.
I recommend the A/B testing calculator available on AB Testguide.
Using this calculator, we can plug in our results and find that the results are statistically significant. We can now say that we are 95% confident that the shorter email subject line increased the email open rate.
Next Steps
I hope that now you can begin fully formulating your own A/B tests that can improve your lead generation, number of conversations, and number of deals closed.
A/B tests can be created for almost all aspects of your sales cycle. I recommend starting small, such as with your sales script. Have fun with it!


