Sales managers who lead high-performing sales teams are fundamentally data-driven. Critical to their teams’ high-performance is the use of Key Performance Indicators (KPIs) to measure progress toward goals and spot opportunities for improvement. Managers can measure anything, but successful ones closely monitor the drivers of revenue – like how many deals a rep owns per period, how quickly they close, how many of those they win, and how big the deals are, to name a few. An increase in any of these metrics for even a single sales rep means revenue growth for the team.
Once revenue drivers are tracked, improving revenue boils down to choosing one driver and focusing on improving it. For example, focusing on the speed with which a deal closes, if a manager sees a large disparity in closing times between reps, he or she can study how the fastest closing reps work their magic, and can coach the slowest closing reps on those tactics to speed up their deals. If all reps show similar but slow closing times, then managers can look outside of the organization for a potential solution. Once closing times decrease, reps handle more deals per period, and the team’s revenue increases.

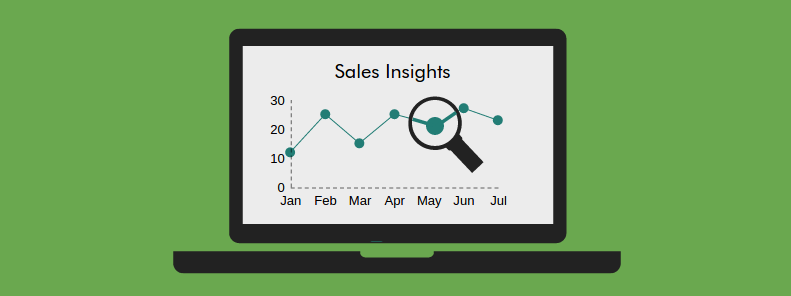
Selecting which factors to measure and focus on isn’t always easy. What works in some cases isn’t always relevant to otherss. To help sales organizations develop a base-line for what to focus on, we’ve launched a new Sales Insights dashboard, which visualizes common key metrics. Read on to learn about 7 of them, and why they’re important.
Activity Count:

The activity count chart displays the phone calls, emails, and meetings that each sales associate has in a period. Comparing this chart from associate to associate provides a relative measure of how effectively sales associates are using their time. It is natural for some to do more and some to do less, and this chart alone does not predict success or failure. Opportunities for coaching, however, can be spotting associates that have both low activity rates and low deal closing rates. Someone that falls on the lower end on both charts may be a prime candidates for coaching on time management.
Activity Efficiency:

While the activity count chart shows how salespeople use their time, the activity efficiency chart shows how effectively that time spent translates into results. Having 10 prospecting calls that yield 5 potential deals is far more productive than having 20 that yield 3. Sales associates with continuously lower activity efficiencies are prime candidates for coaching in value communication, pitch delivery, and negotiation.
Pipeline activity by owner:

Higher value opportunities deserve more attention than lower value ones. If sales associates don’t have time to address everyone in the funnel, they should generally spend more time with their larger opportunities to see a higher return on their invested time. The pipeline activity chart shows how salespeople spend time with deals based on deal size. In an ideal organization, larger circles are seen toward the top of the chart, and smaller ones to the bottom. If the opposite is seen, and you often see larger deals go stale, then associates should consider reallocating their time toward larger deals.
Pipeline value:

Pipeline value is the total value of opportunities that your sales team is has in its pipeline in a given period. The green line measures the value of deals won, and deals lost in that period. A healthy sales pipeline will lead to a larger blue bar over time, and upward sloping green line. If closed lost opportunities, however, begin to creep up it’s important to review past closed lost opportunities to determine where the organization or sales team is dropping the ball.
Funnel analysis:

Finding weaknesses in the sales pipeline itself, can be a source of opportunity for sales managers to improve win rates. With sales funnel analysis, managers learn what the leakiest funnels of the sales stage are. If it’s in the early stages, then managers will have to train associates in pitching, relationship building, and nurturing. If the leakiest parts of the funnel are later on in the sales funnel, then the associates have to be trained to overcome objections and negotiate better.
Sales cycle by duration:

As sales associates become more adept at selling, the amount of time required to progress an opportunity through the sales funnel should ideally decrease. Vtiger’s sales cycle by duration chart shows the average time a sales associate takes to progress an opportunity through each sales stage. Sales associates that take above average time for a particular stage could be ripe for some coaching. If they’re making it through the early stages, to the mid funnel, for example, then perhaps improved negotiation skills are in order.
Win rate:

The sales win rate chart shows how efficiently a sales associate won deals. Monitoring sales win rates over time helps sales managers identify growth in sales skills. According to the recent The Top-Performing Sales Organization Benchmark Report, surveyed sellers and sales executives categorized their sales associates into 3 groups based on the average win rates: elite performers had over 70% win rate, top performers had over 60% of win rate, and the rest (which made up 80% of the respondents) had about only 40% win rate. When managers coach associates to increase those low win rates, overall revenue grows and everyone wins. And this increase in revenue is achieved through efficiency increases, without an increase in costs or headcount.
Read the documentation to try Vtiger’s new sales insight features today. Not a Vtiger customer? Sign-up for a free 15 days trial to explore sale insights features and many more sales automation tools that helps you boost your sales team’s performance.