Revenue Operations is one of the fastest-growing operational disciplines in B2B businesses today. The case for adopting it is structural rather than cosmetic, not a passing organizational trend. According to Gartner, 75% of the highest-growth companies will adopt a RevOps model by 2026, up from less than 30% today.
Running sales, marketing, and customer success as three separate functions accumulates friction at every handoff. Running them as a single revenue engine reveals where revenue actually leaks and where pipeline stalls before it converts. This guide covers what RevOps is, the three pillars, the metrics that matter, common pitfalls, and how CRM software supports the underlying workflows.
What Is Revenue Operations (RevOps)?
Revenue Operations is the operational alignment of sales, marketing, and customer success. It rests on a shared revenue process, a unified data model, and a common set of metrics. The function consolidates processes, technology, and reporting that each team previously ran independently.
RevOps exists because the separation between these three functions produces leakage at every handoff. The most expensive leaks include the marketing-to-sales lead transfer, the sales-to-customer-success closed-deal transition, and the customer-success-to-sales expansion signal. The unified function eliminates these gaps by holding one shared definition of every revenue event.
The practical effect is that customer-facing teams share a definition of a lead, a qualified opportunity, and an expansion-ready account. Each team no longer maintains its own version of these terms. Definitions become operational rather than aspirational.
The same applies to the underlying data layer. A lead created in marketing automation becomes a contact in sales without losing source attribution. The record then becomes a customer in support without losing purchase context, producing one continuous customer journey.
3 Operational Pillars of Revenue Operations
The RevOps framework rests on three operational pillars that together cover the full surface of revenue work. Each pillar has a specific scope, a defined set of responsibilities, and a specific failure mode when neglected. Treating any one as optional compromises the other two, which is why mature RevOps functions invest in all three from the start.
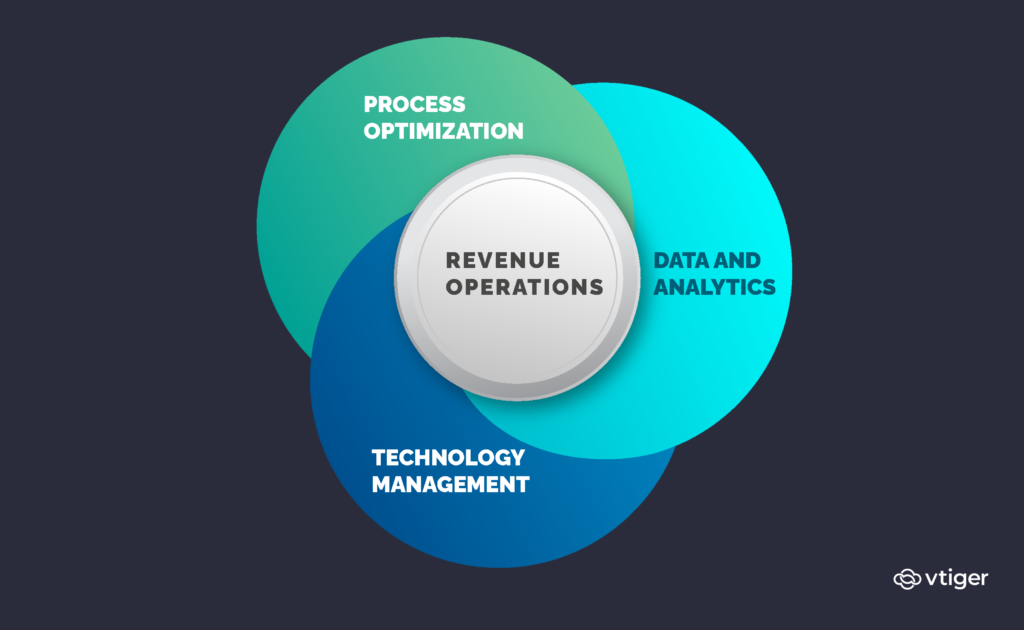
Process Optimization
Process optimization streamlines the buyer journey from lead generation through renewal and expansion. The work covers lead routing rules, pipeline stage definitions, qualification criteria, contract approval workflows, and the renewal handoff. A documented sales process is the prerequisite for every other RevOps capability.
Without process documentation, the data the team collects describes a workflow that varies by person rather than one operating as a system. The discipline shows up in small operational details. A Stage 3 opportunity needs to mean the same thing across all regions, not just on paper.
Technology Management
Technology management rationalizes the revenue tech stack across CRM, marketing automation, customer data platforms, sales engagement tools, and analytics layers. The work is not just selecting tools but designing the integration architecture that lets data flow cleanly. Every integration boundary is a potential source of data drift.
Teams that consolidate around fewer, well-integrated platforms generally outperform teams that maintain best-of-breed stacks with multiple sync layers. The reason is structural rather than philosophical. Modern AI-powered CRM capabilities work best when the data foundation is unified rather than fragmented.
Data and Analytics
Data and analytics produce the visibility that the other two pillars depend on. The work covers metric definition, dashboard design, forecast modelling, attribution analysis, and the data hygiene that makes reporting reliable. Without this layer, the other pillars operate without visibility into their own performance.
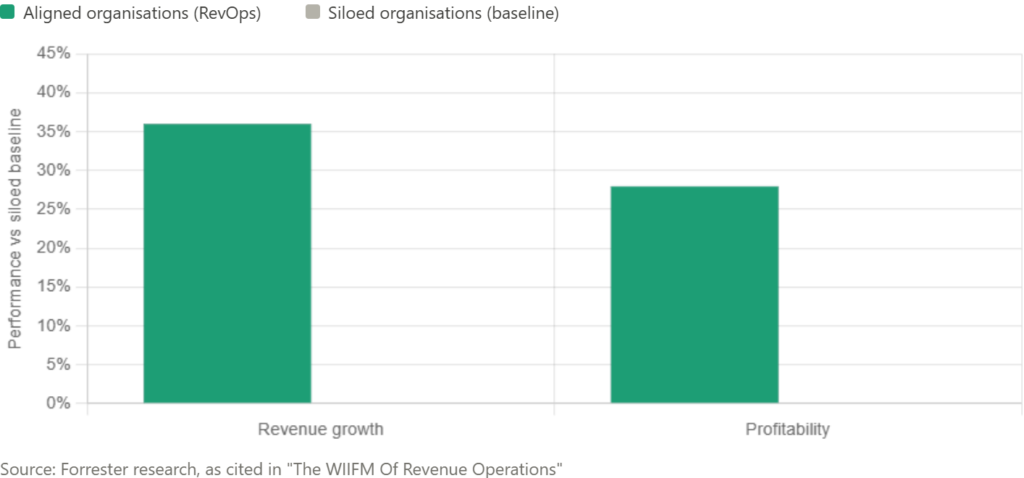
According to Forrester research, organizations aligning people, processes, and technology across their revenue engine achieve 36% more revenue growth and up to 28% more profitability compared to siloed organizations. The measurable case is strong. Building on CRM analytics reporting turns data presence into decision support.
Key Revenue Operations Metrics to Track
RevOps relies on a small set of quantifiable metrics spanning the full customer lifecycle. The metrics surface specific operational signals: where the pipeline is healthiest, where deals stall, which segments retain best, and where acquisition cost is sustainable. Each metric is chosen to answer a specific operational question.
Aggregating metrics by segment rather than at the company level is where decisions actually get made. The company-level average rarely reflects how any single segment behaves. Segment-level discipline distinguishes dashboards that inform from dashboards that decorate.
According to Forrester’s 2021 RevOps Survey, the top three benefits organizations attribute to RevOps are improved revenue growth (41%), improved customer satisfaction (36%), and increased profitability (35%). Each outcome traces back to a defined set of metrics. The unified function can move metrics that fragmented functions could not.
A disciplined approach to customer segmentation is what turns aggregate numbers into segment-specific decisions. Without segmentation, RevOps teams optimize for averages that may not match reality. The five core metrics that consistently appear in mature RevOps dashboards are listed below.
- Customer Acquisition Cost (CAC): Total cost to acquire a new customer, including sales, marketing, and onboarding investment, normalized against the customer cohort that closed in the same period.
- Customer Lifetime Value (CLV): Total revenue a customer is expected to generate over the duration of the relationship, the denominator for measuring whether CAC is sustainable.
- Net Revenue Retention (NRR): Percentage of recurring revenue retained from existing customers, including upgrades, downgrades, and churn, segmented by cohort and product line.
- Sales Cycle Length: Average time from first qualified opportunity to closed-won deal, segmented by deal size for actionable signal rather than misleading averages.
- Pipeline Coverage Ratio: Ratio of pipeline value to revenue target for the period, the leading indicator that tells RevOps whether the forecast is achievable.
Tracking these metrics consistently across quarters produces the trendline that distinguishes durable RevOps performance from quarterly variation. Trendlines are what executive leaders need when deciding scope expansion. Quarter-over-quarter movement also surfaces correlations like falling sales cycle length tracking with rising pipeline coverage.
Common Revenue Operations Pitfalls That Undermine Growth
RevOps implementations fail more often due to process gaps than to technology gaps. The most expensive mistakes are not about tool selection but about how the function is structured. Three pitfalls recur across organizations that adopted RevOps but did not see the gains the framework predicts.
Renaming Sales Operations Without Changing the Process
Many organizations adopt RevOps by renaming Sales Operations and adding marketing and customer success representatives to its leadership. The underlying processes, data definitions, and handoff workflows often stay untouched. The result is a Sales Operations team with a new title and wider scope on paper, but no new authority.
The work of a CRM executive during this transition often involves facilitating cross-functional ownership rather than adding new technology. Process alignment is the harder problem. Most title-change initiatives skip the harder problem entirely, then wonder why the function did not produce the expected gains.
Single Source of Truth Without Data Governance
The single source of truth principle is foundational to RevOps but routinely misapplied. Most organisations declare the CRM the single source of truth without investing in data stewardship, field standardisation, or naming conventions. The infrastructure is declared rather than built.
According to Cirrus Insight’s 2025 CRM analysis, the average CRM user adoption rate among sales professionals is 72%, meaning 28% of reps with CRM access are not using the system consistently. Inconsistent usage becomes inconsistent data. The single source of truth without governance becomes the single source of inconsistent records.
Metric Accumulation Instead of Metric Discipline
RevOps teams routinely accumulate dashboards rather than disciplining themselves to the small set of metrics that actually drive decisions. The pattern usually starts with good intentions. The team adds metrics to answer specific questions, then continues adding them without retiring those that no longer inform action.
A thoughtful set of CRM strategies involves removing metrics that produce noise rather than adding new ones. The discipline is a quarterly review that prunes dashboards as actively as it builds them. Removing data is harder than adding it, which is why most teams skip the prune.
How CRM Software Supports Revenue Operations Workflows
A CRM is the operational layer that holds the customer record RevOps depends on. Most RevOps functions either adopt or extend an existing CRM rather than building parallel systems for sales, marketing, and customer success. The capabilities below describe the specific functions that RevOps teams use.
Each function below addresses a workflow that requires unified data to operate correctly. Vtiger One holds these capabilities against the same customer record. The unified record is what allows successful retention-led programmes to operate without the data sync overhead that fragments multi-platform stacks.
Sales Pipeline and Forecast Alignment
Pipeline visibility and forecast accuracy are the two most-cited reasons sales leaders adopt a unified CRM. Both capabilities depend on a single record per deal that everyone references. Stage definitions, ownership rules, and forecast inputs need to be applied consistently across teams.
- Unified pipeline view: A single record per deal showing stage, owner, expected close date, deal value, and engagement history across the team.
- Forecast roll-up by segment: Pipeline data segmented by deal size, vertical, and source, so forecast accuracy can be measured per segment.
- Stage conversion analytics: Conversion rates between defined pipeline stages, which tell the team where deals stall before commit.
Marketing and Sales Lead Handoff
The handoff between marketing and sales is the highest-leakage point in most B2B revenue funnels. CRM-led handoff with shared scoring and source attribution is what closes the leak. Lead scoring criteria need to be agreed jointly rather than delegated to one team.
- Lead scoring with shared definitions: A scoring model both teams agreed on, applied through a lead management system that routes qualified leads automatically.
- Source attribution: Tracking of every lead back to its original source, producing the cost-per-source data marketing uses for spend allocation.
- Nurture handoff sequences: Long-cycle nurture managed through marketing automation that transitions ownership to sales when engagement signals justify it.
Data unification is the layer where RevOps either succeeds or quietly fails. Success depends on whether the customer record reflects every interaction or only the ones each team chooses to log. The architectural decision behind unification matters more than the feature surface itself.
- One customer record: A consolidated view holding every interaction across sales, marketing, and support, with marketing CRM and sales functions writing to the same record.
- Predictive insights for next action: The Calculus AI layer analyses historical CRM data and recommends the next best action for each deal, predicting and recommending while final action stays with the user.
- Cross-functional reporting: Shared dashboards covering sales, marketing, and support metrics on the same data foundation, removing the version control problem.
Revenue Operations is now established as an operational discipline rather than a passing organizational fashion. Gartner’s 75% adoption projection by 2026 reflects how quickly the function has matured. The discipline succeeds when the three pillars are built in concert rather than sequentially.
Vtiger One’s unified customer record provides the operational foundation that lets RevOps teams execute against shared metrics. The data sync overhead that fragments multi-platform stacks is removed. The Calculus AI layer surfaces predictive insights as decision support, with final action remaining with the human user.
Frequently Asked Questions (FAQs)
Q1. What is Revenue Operations (RevOps)?
Revenue Operations is the operational alignment of sales, marketing, and customer success around a shared revenue process, unified data model, and common set of metrics. The function consolidates processes, technology, and reporting that each team previously ran independently. The goal is one continuous customer journey rather than three disconnected workflows.
Q2. How does Revenue Operations differ from Sales Operations?
Sales Operations focuses on the sales function alone, including pipeline management, sales enablement, and quota administration. Revenue Operations extends the same operational discipline across marketing and customer success as well. The difference is scope: Sales Operations optimises within sales, while RevOps optimises across the full revenue lifecycle including pre-sale demand and post-sale retention.
Q3. What are the key Revenue Operations metrics to track?
The core metrics include Customer Acquisition Cost, Customer Lifetime Value, Net Revenue Retention, Sales Cycle Length, and Pipeline Coverage Ratio. Effective RevOps functions track a small disciplined set rather than accumulating dashboards. The metrics that matter are segment-specific rather than aggregate, because averages across segments usually hide where the actionable signal lives.
Q4. What does a Revenue Operations team do?
A Revenue Operations team manages process optimisation, technology stack alignment, and data analytics across sales, marketing, and customer success. Daily work includes pipeline stage governance, lead routing, forecast modelling, dashboard maintenance, and data hygiene. The function supports the three revenue-facing teams rather than competing with them for ownership of customer relationships.
Q5. What is the best CRM for Revenue Operations?
The best CRM for Revenue Operations holds sales, marketing, and customer success data against a unified customer record with shared pipeline, scoring, and reporting layers. Critical features include forecast roll-up, source attribution, lead scoring, marketing automation, and customer journey visibility. Predictive insights surfaced inside the workflow add decision support on top of this base layer.
Q6. How does AI support Revenue Operations?
AI supports Revenue Operations by surfacing predictive insights against the unified customer record, including next-best-action recommendations, churn risk scores, and forecast improvements. The most useful AI applications in RevOps are recommendation systems that augment human decisions rather than autonomous systems. The system surfaces the insight; the human still decides what to act on.
Q7. How long does it take to implement Revenue Operations?
Most organizations see initial operational improvements within the first quarter of RevOps adoption. Full alignment across sales, marketing, and customer success typically takes 12 to 18 months. The faster wins come from process documentation and dashboard consolidation.
Q8. Is Revenue Operations a good career?
Revenue Operations is consistently ranked among the fastest-growing operational roles in B2B businesses, with demand spanning startups through enterprises. The role rewards a combination of analytical skill, process design experience, and cross-functional facilitation ability. Career trajectories typically progress from analyst through manager into director or head-of-RevOps roles as company size grows.
Sources cited:
¹ Gartner, “Revenue Operations: The What, Best Practices and RevOps Guide”. https://www.gartner.com/en/sales/topics/revenue-operations
² Forrester, “The WIIFM (‘What’s In It For Me?’) Of Revenue Operations”, citing 2021 Revenue Operations and Buying Groups Survey. https://www.forrester.com/blogs/the-wifm-whats-in-it-for-me-of-revenue-operations
³ Cirrus Insight, “CRM Statistics, Trends, and Predictions: A 360° View of the CRM Market for 2025”, 2025. https://www.cirrusinsight.com/blog/crm-statistics-trends-and-predictions